From simple statements to simplifying complex concepts, CropLife International’s infographics make an impact in social media. Check out the 10 most popular graphics from 2016 that we encourage you to share.
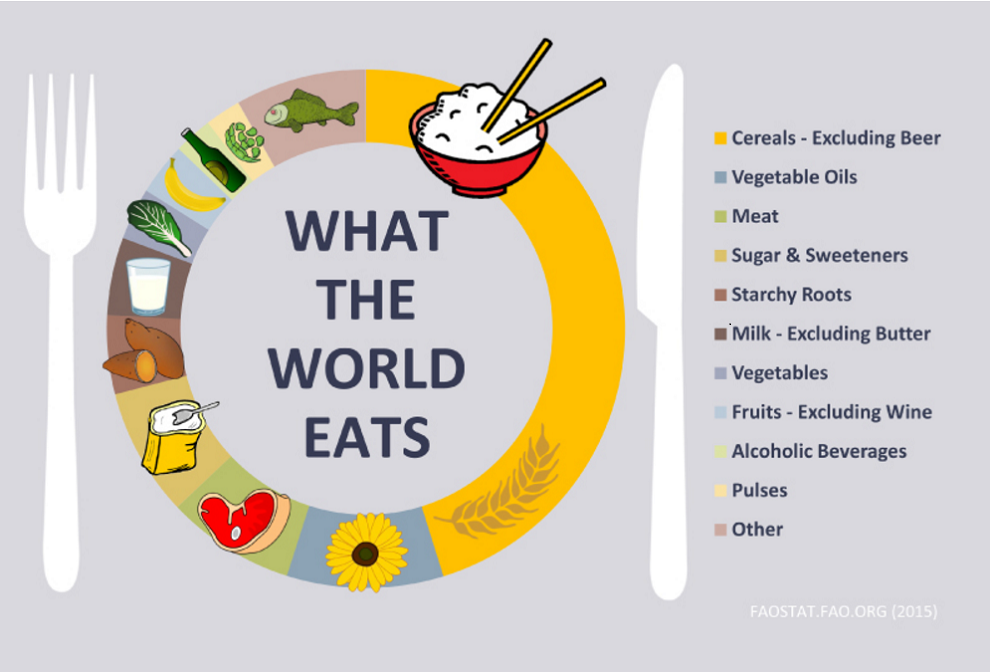
- What does the world #eat? Mostly #plants. How do we improve plant performance? Mostly science. @FAOstatistics pic.twitter.com/bH8HB933Yx
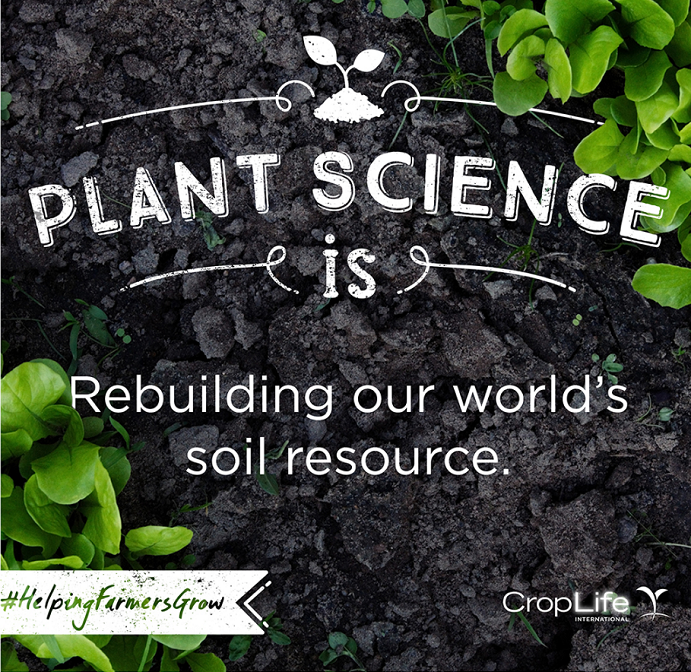
2. #Soil stores 10% of the world’s carbon dioxide – more than the atmosphere and vegetation combined. pic.twitter.com/Aw0279kEJo #plantscience
3. #Agriculture is a $2.4 trillion industry led by 1.3 billion farm workers. It’s worth protecting! goo.gl/pC4QJC

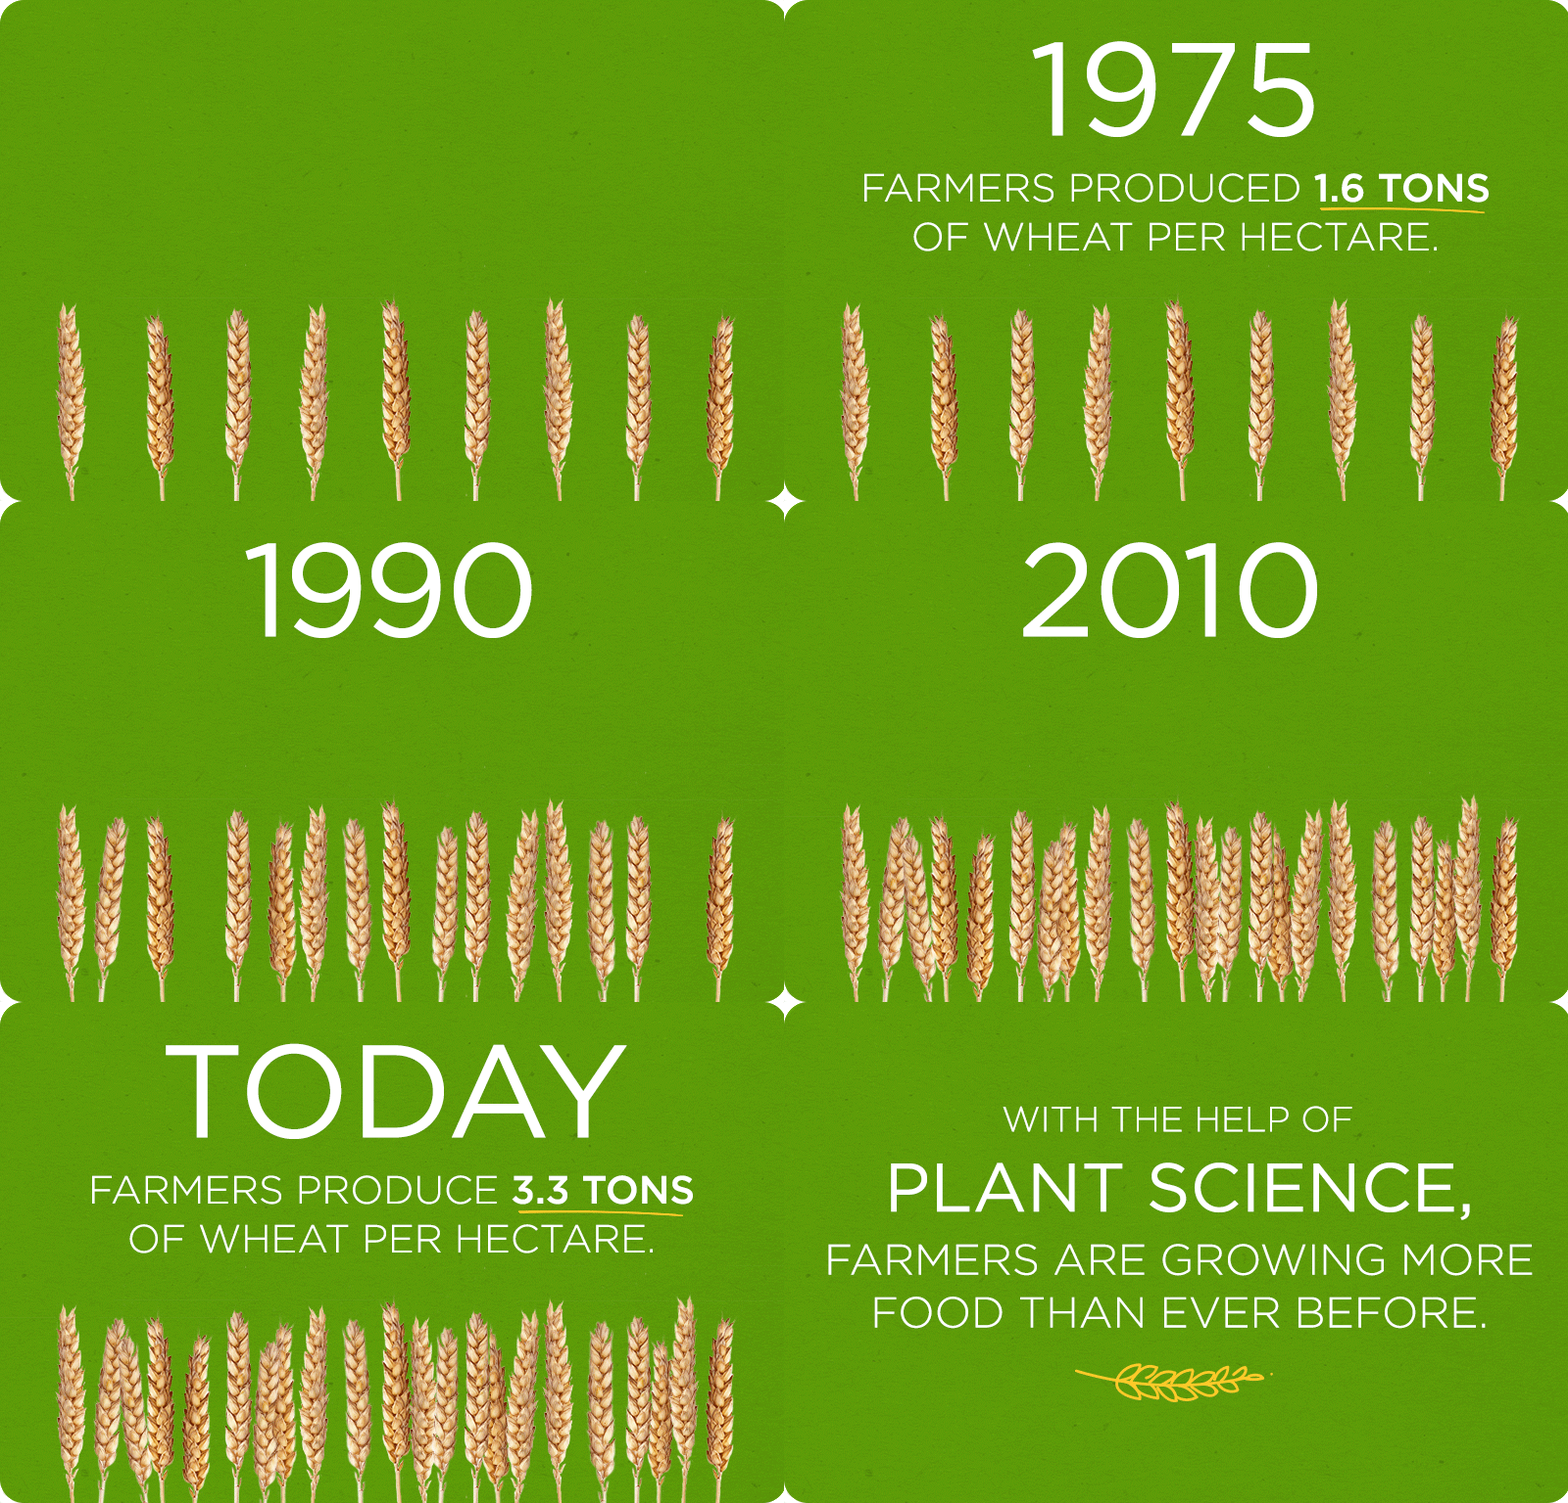
4. #PlantScience has helped preserve 500 million hectares of biodiverse land since 1975. goo.gl/G3MwEv
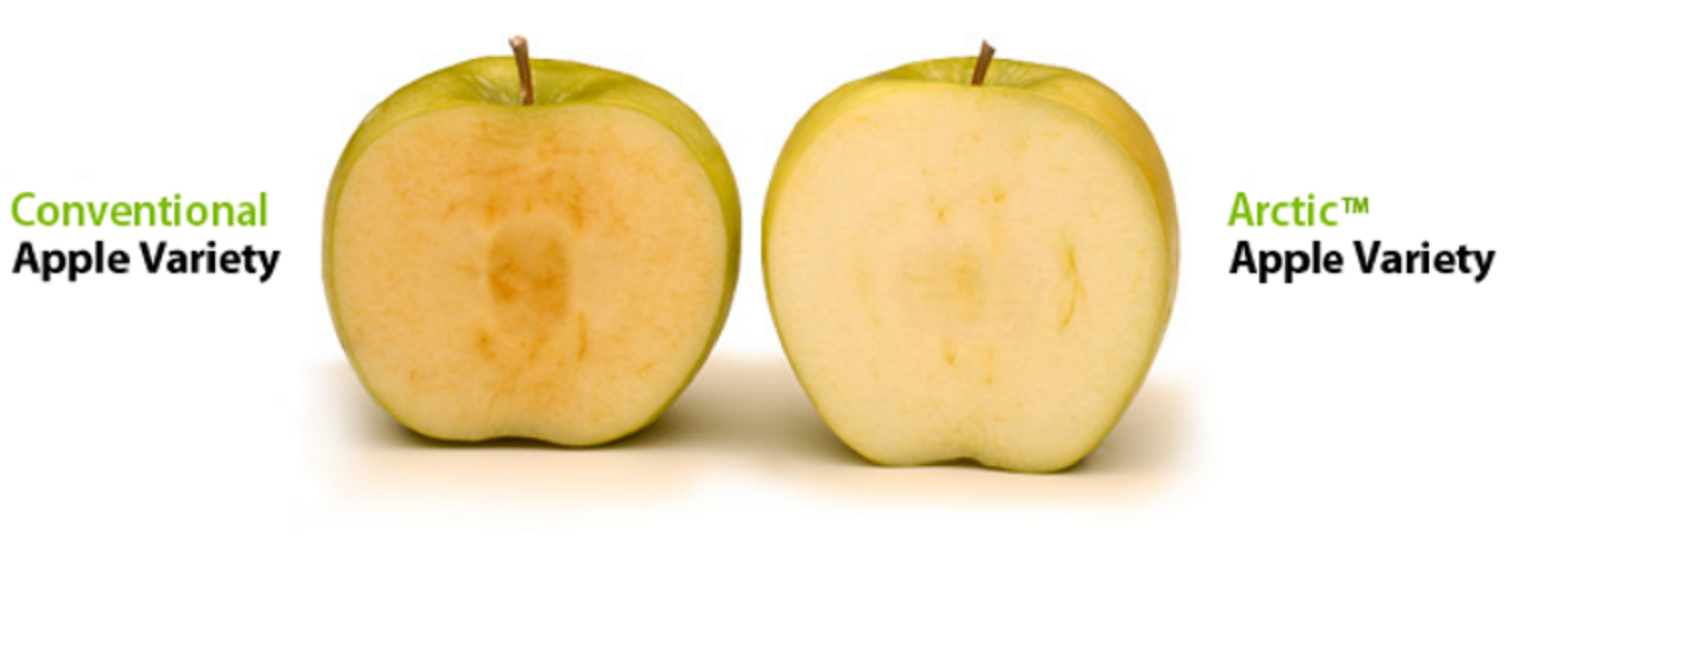
5. DYK 40% of #apples are wasted globally? @ArcticApples aim to reduce the waste with science! goo.gl/eqRWnF pic.twitter.com/Uu0fTEXYPD
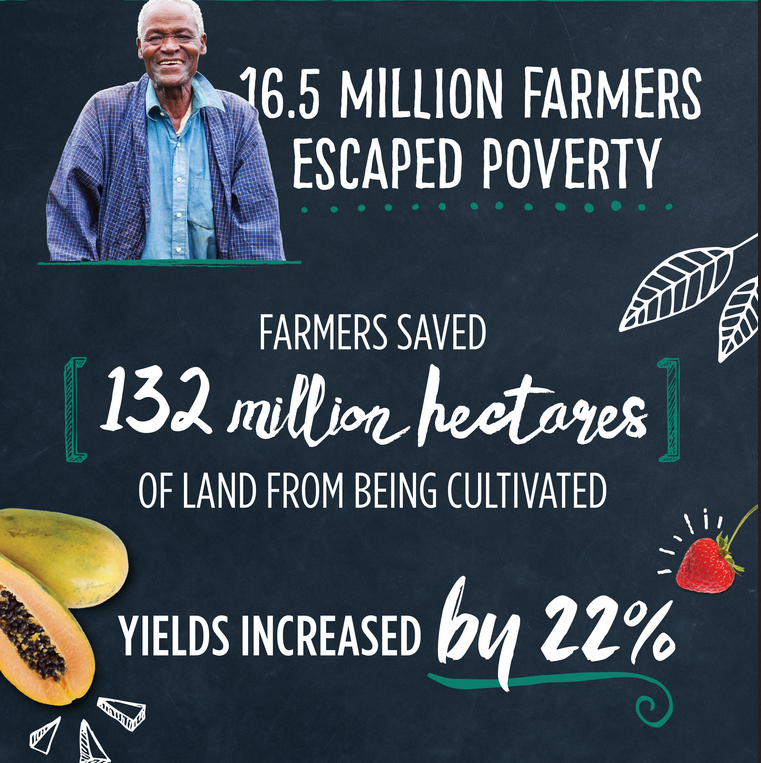
6.
What happened when #farmers started growing #biotech crops? Yields increased 22%. Learn more: tablefortwenty.org. pic.twitter.com/IOkNFS9LID
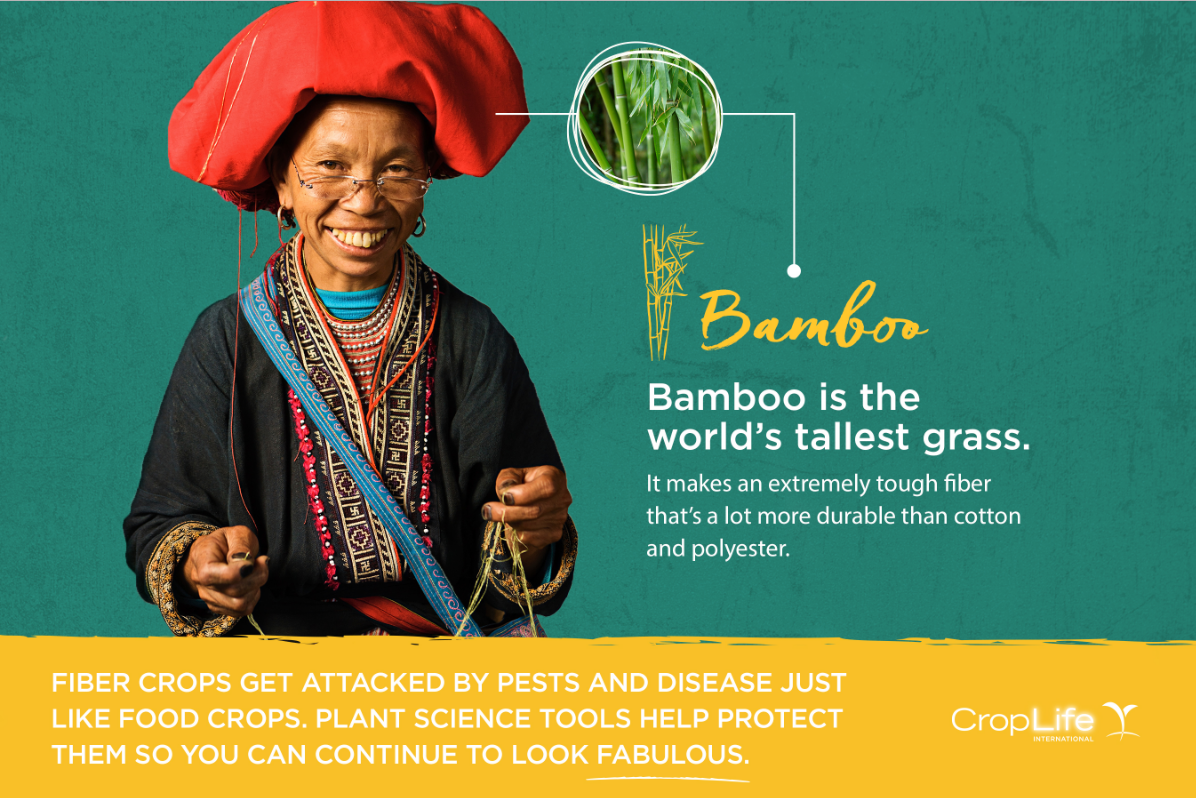
7. #Crops provide fiber for textiles, not just food. #Bamboo T-shirt, anyone? http://bit.ly/1XBVQLp
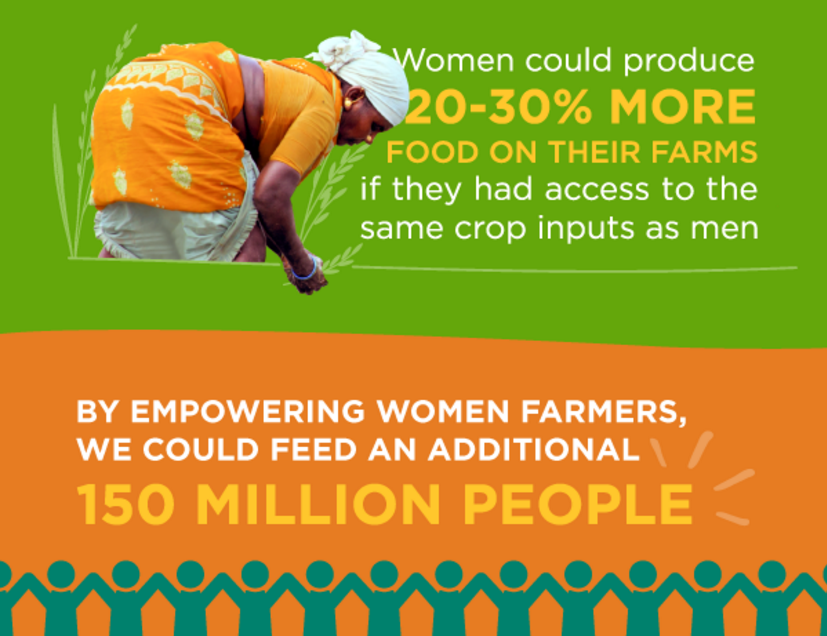
8. Empowering #women in #agriculture is vital to sustainable food production. http://goo.gl/lHSaeY
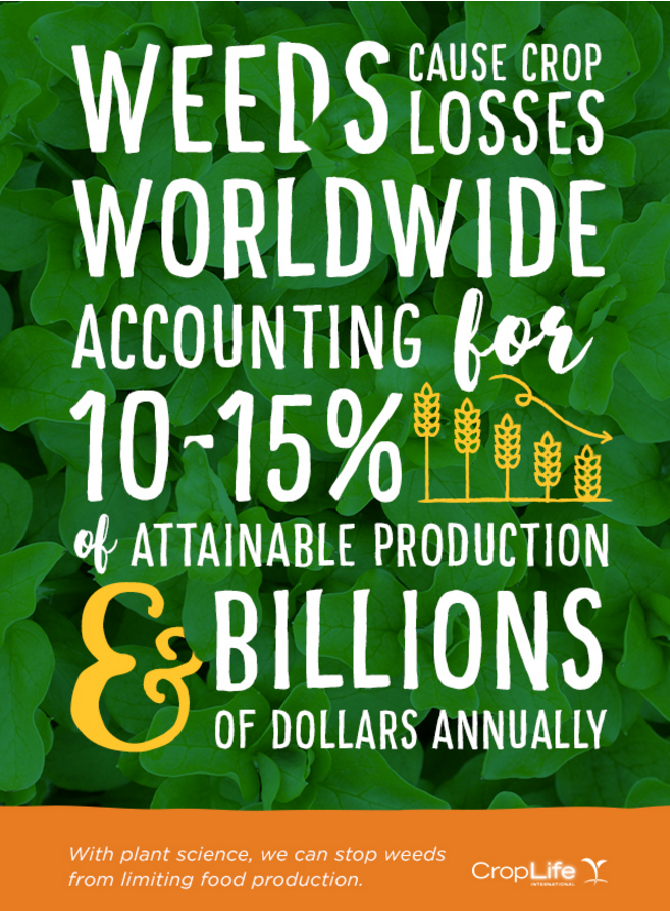
9. Why do we need #herbicides? Because weeds destroy our food crops. https://goo.gl/7Cm8Jc
10. Herbicides improve your golf game by preventing weeds from blocking your shots! http://bit.ly/2g1jUYd

